While Vroniplag Wiki is usually restricted to the documentation of plagiarism, there are several problematic observations in the results section of the thesis that can be documented on the basis of the published thesis alone. This is done here.
Figure 11 (relevant part on page 41)[]
The problem with figure 11 is that the two point clouds in the first row of page 41 ("MLN") are identical up to the smallest detail, while they are meant to represent measurements on different samples:

- Figure 11: HA-specific CD4+ T cells are present in periphery of SPC-HA x TCR-HA mice. SPC-HA x TCR-HA and TCR-HA control mice were sacrificed, lung and BLN, MLN, Spleen, AXLN, INLN, CVLN were isolated and stained for CD4 and 6.5 expression to measure the percentage of transgenic T cells in the different compartments. These results are a representative of two similar experiments.
The point clouds in the first row ("MLN") enlarged:
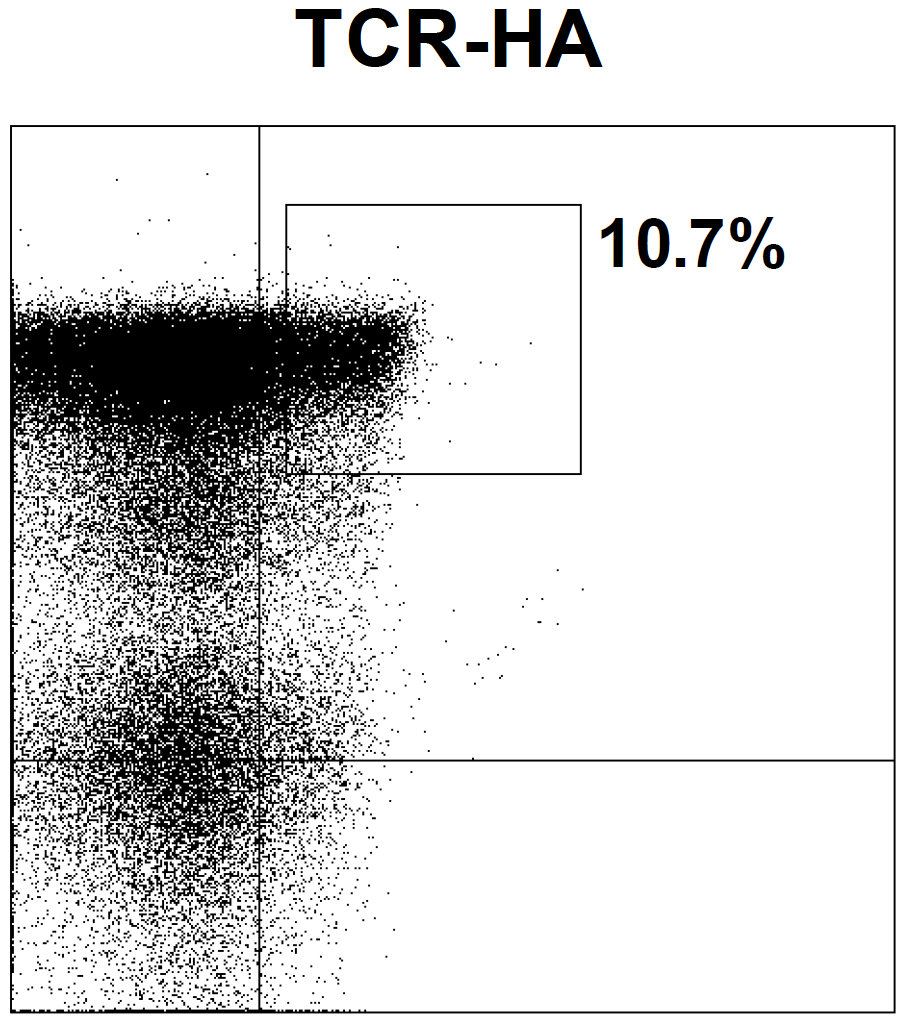
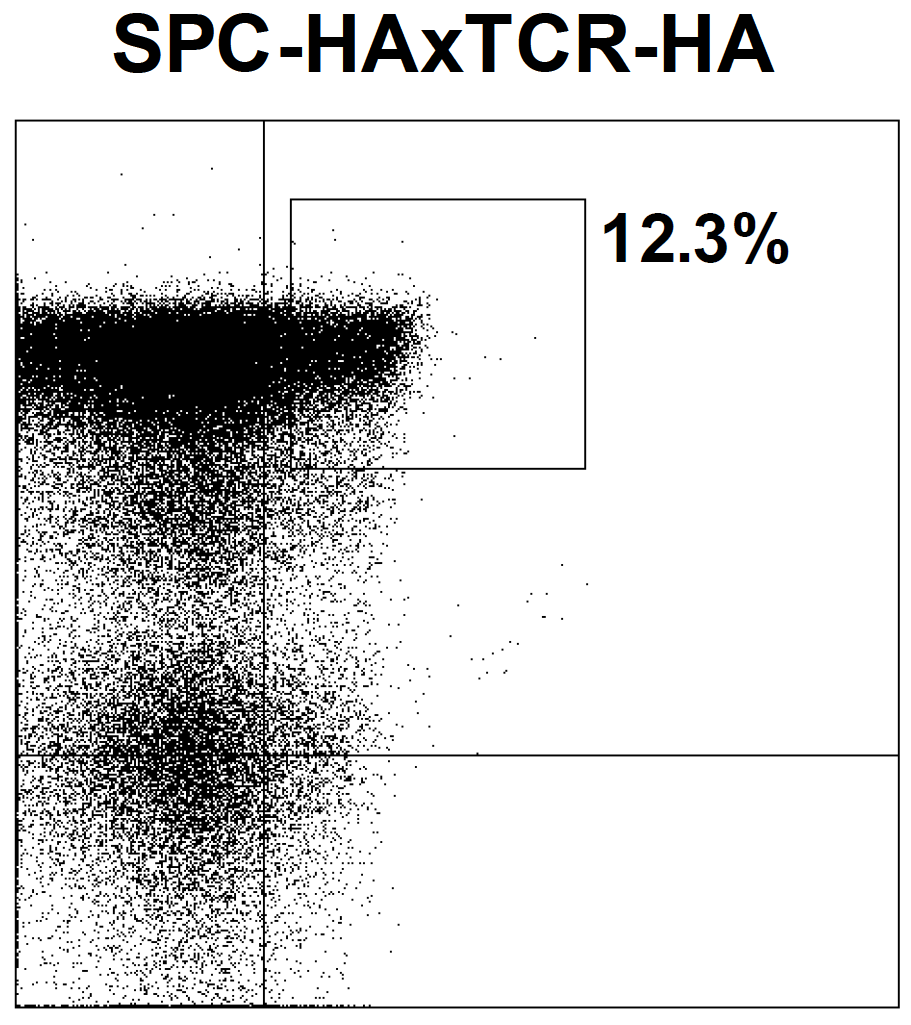
Figure 13 (page 47)[]
The problem with figure 13 is that the alphaEbeta7 Integrin, CD103 panel is identical to the Foxp3 panel, as can be seen easily from the characteristic white specs on both panels:
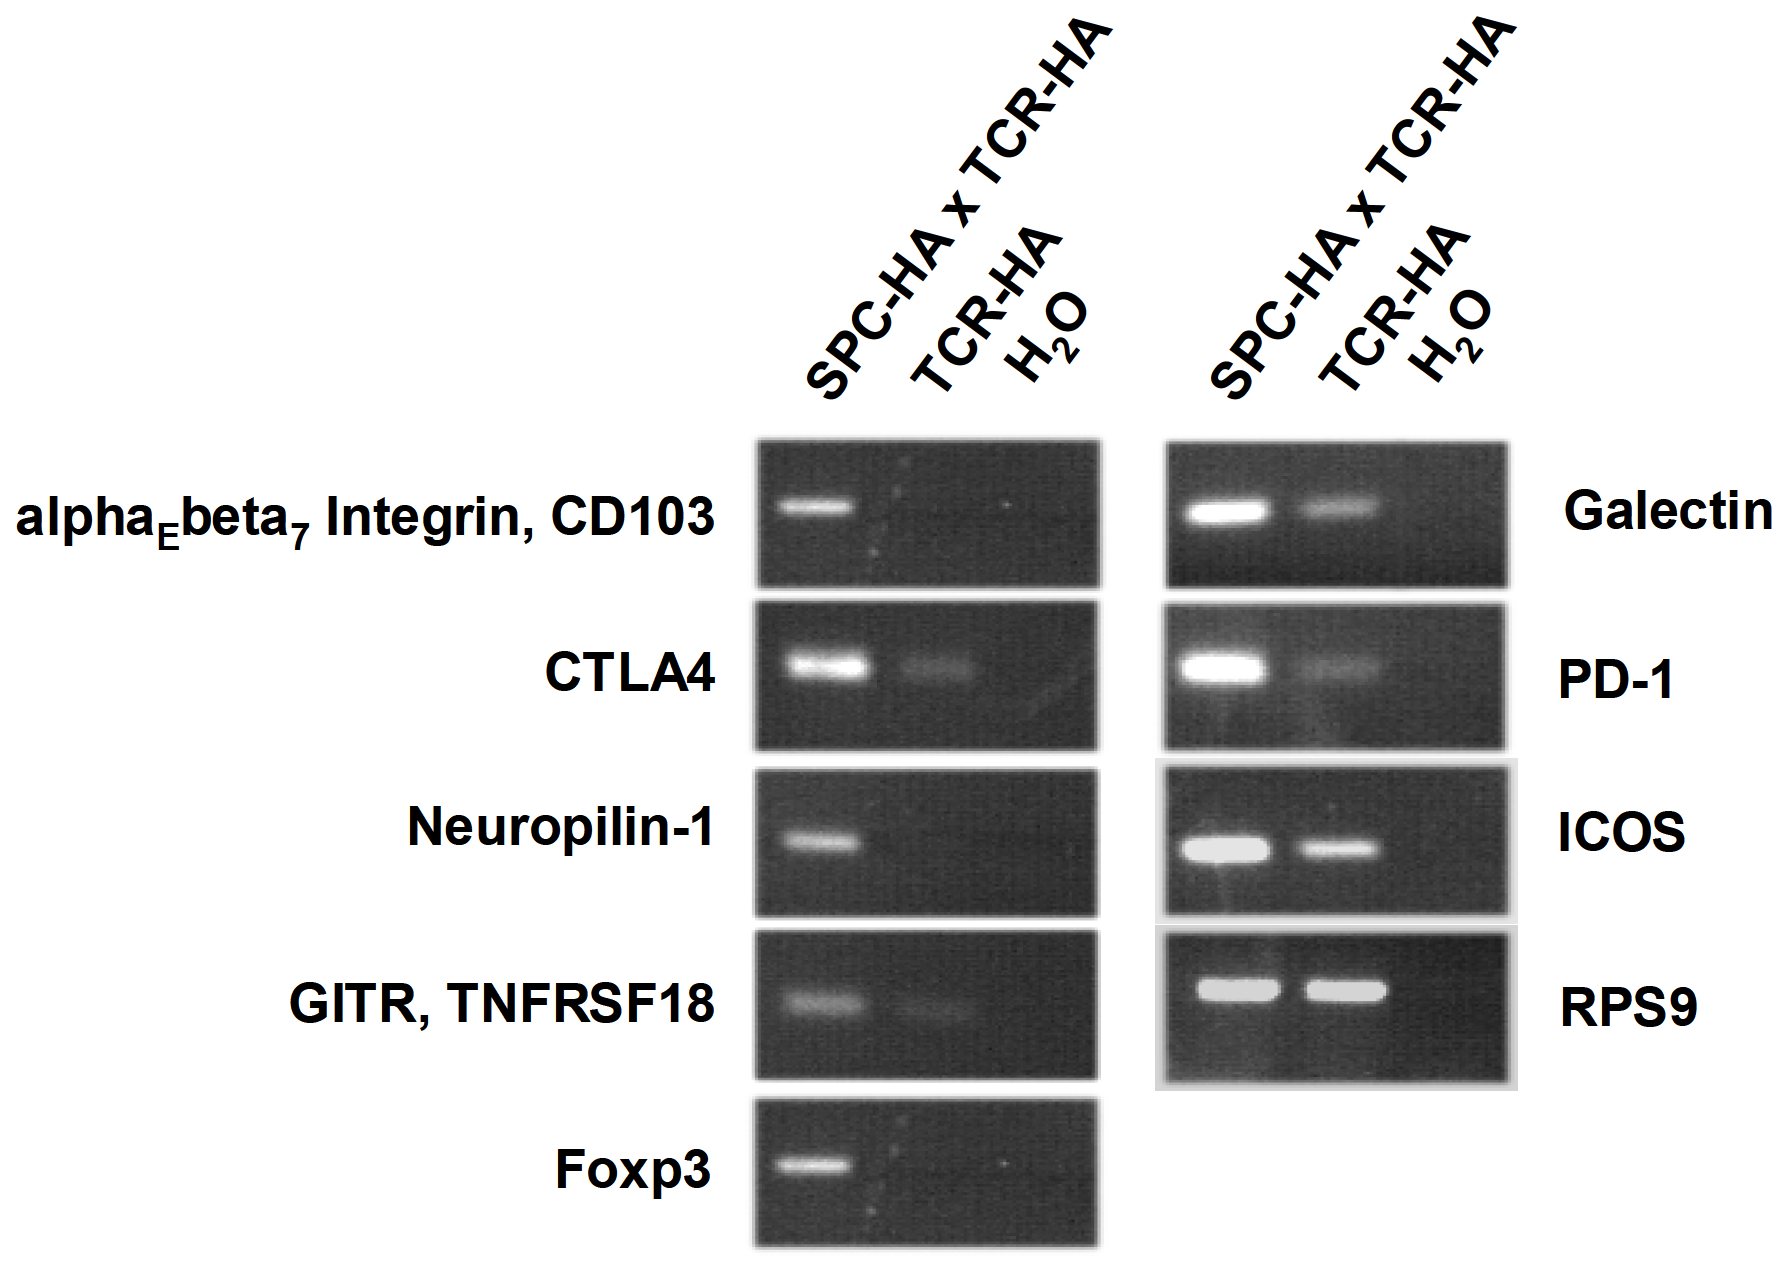
- Figure 13: Semi-quantitaive RT-PCR analysis of ex vivo isolated 6.5+CD4+ lung lymphocytes from SPC-HA x TCR-HA mice and TCR-HA control mice. The expression of different molecular marker genes for regulatory T cells as CD103 (alphaEbeta7), CTLA4, Neuropilin-1, GITR (TNFRSF18), Foxp3, Galectin, PD-1 and ICOS was analyzed. RPS9 was used as a housekeeping gene.
The alphaEbeta7 Integrin, CD103 panel enlarged:
The Foxp3 panel enlarged:
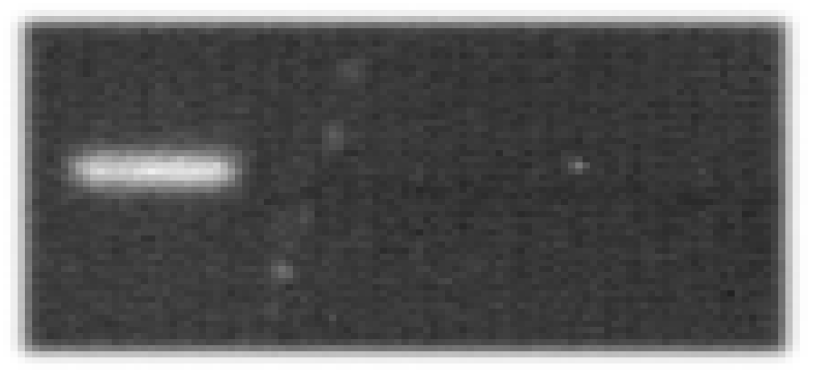
Figure 21 (page 60) and figure 24 (page 68)[]
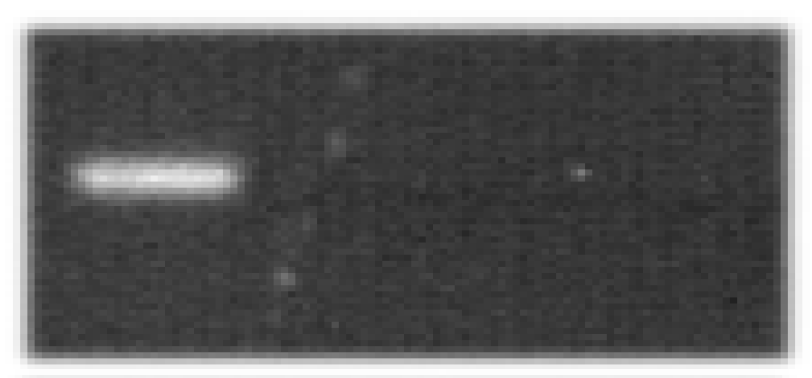
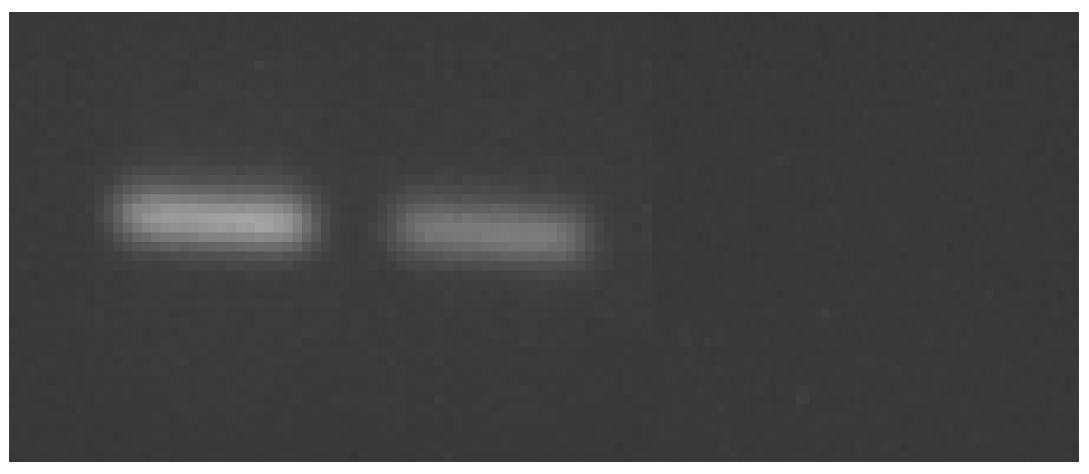
The problem with figures 21 and 24 is that the second panel of the second row of figure 21 ("SP-C") and the third panel of the third row in figure 24 ("RPS9") appear to have been derived from the same image, as suggested by two white specs having exactly the same position in both panels as well as other minor identical patterns in the background.
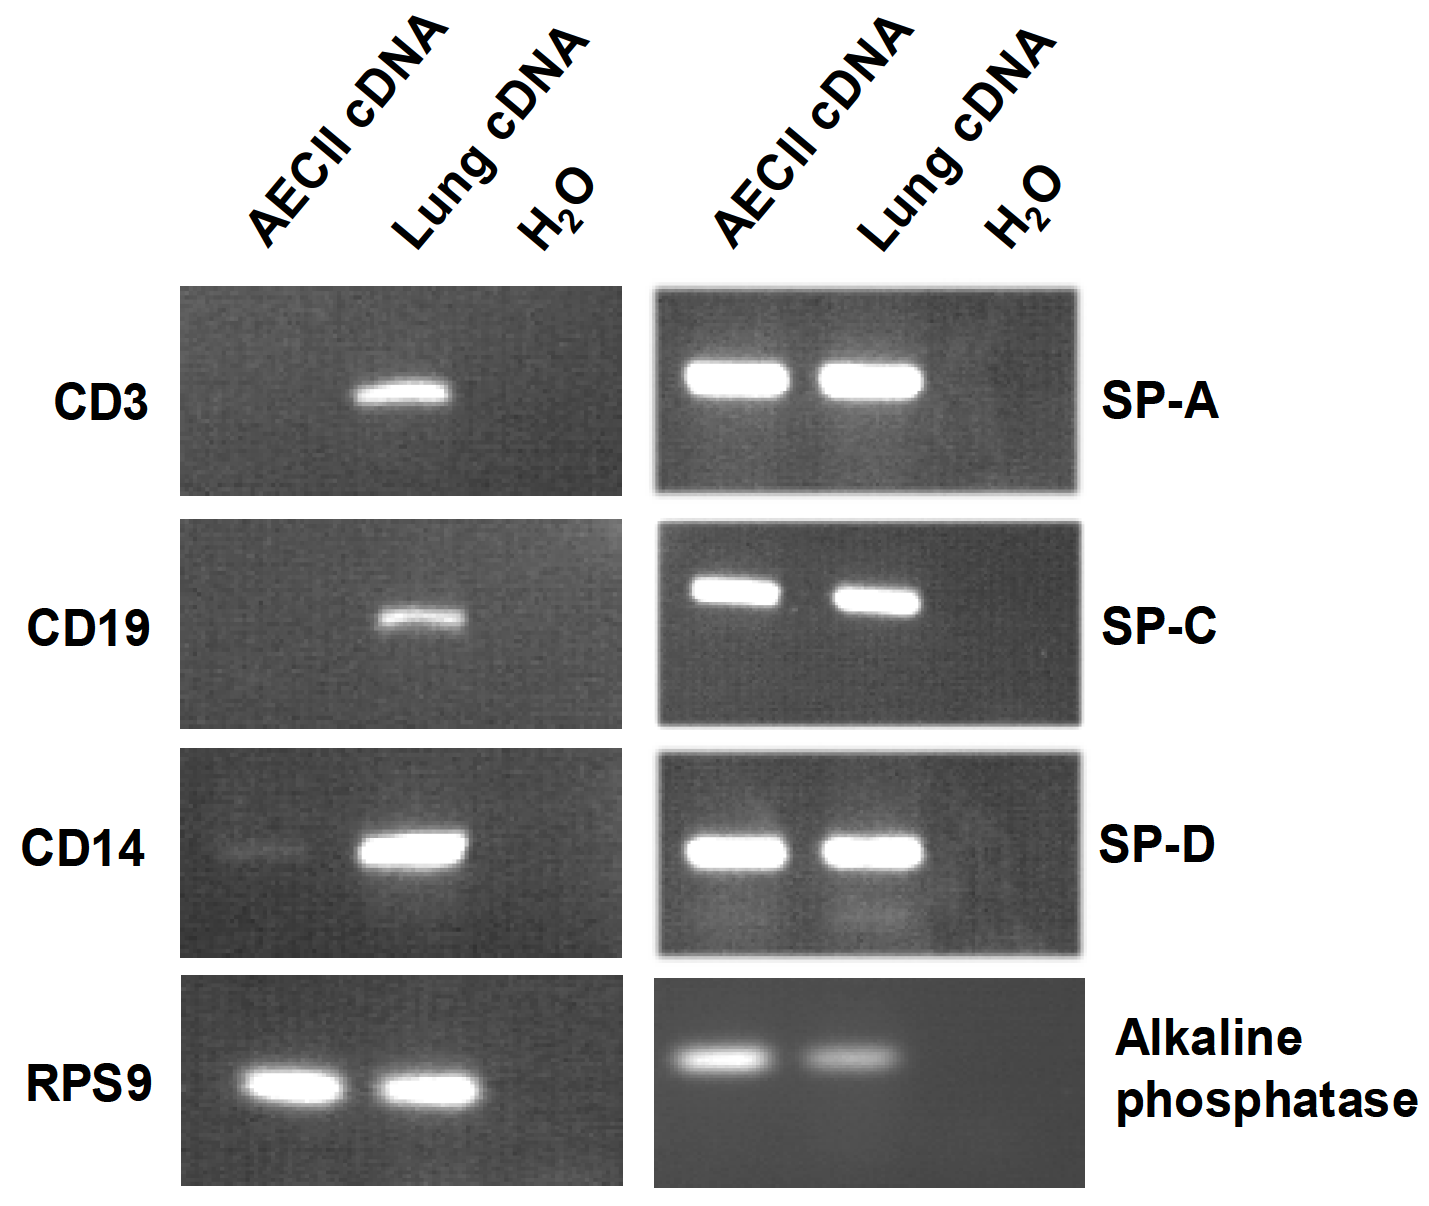
- Figue [sic] 21: Analysis of hemapoetic cell contamination of post-sorted AECII population by PCR. RNA from freshly isolated alveolar type II epithelial cells was compared with RNA obtained from complete lung tissue. Primer pairs CD3, CD19 and CD14 were chosen to test for hemapoetic cells in the type II cell preparation. Primer pairs SP-A, SP-C, SP-D and alkaline phosphatase were chosen to test the RNA for specific AECII expressed genes. RPS9 represents a housekeeping gene expression.
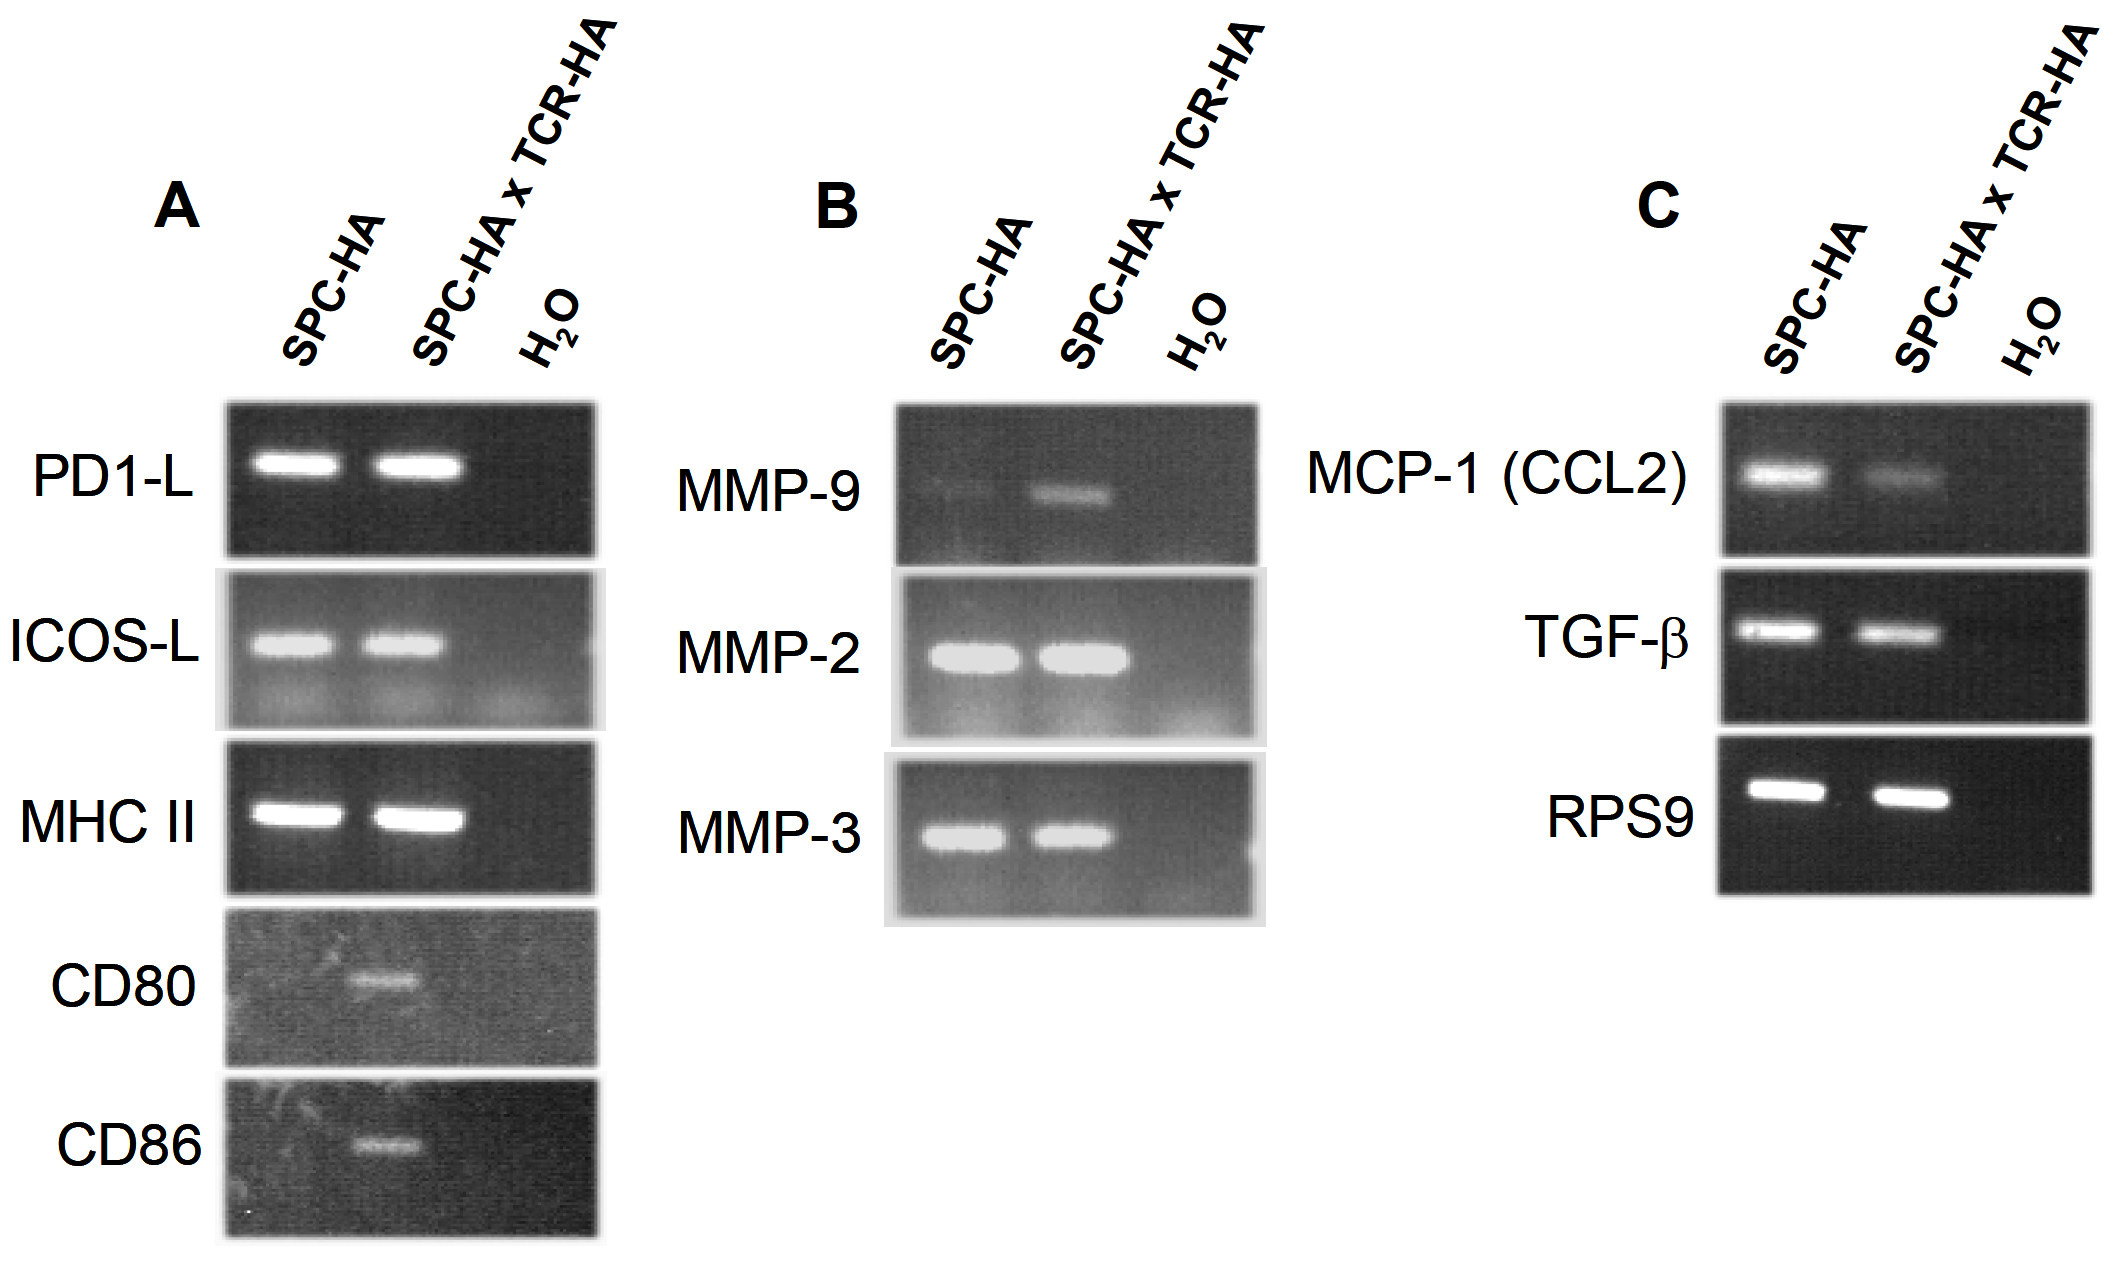
- Figure 24: Gene expression in AECII derived from SPC-HA x TCR-HA double transgenic mice and SPC-HA transgenic mice. Different genes were selected to analyze their expression level in AECII by RT-PCR. (A) Genes encoding costimulatory molecules (PD1-L, ICOS-L, MHC II, CD80 and CD86) were used to determine the stimulatory capacity of AECII on the molecular level. (B) represents selected genes for Matrix metalloproteinase (MMP-9, MMP-2 and MMP-3) and (C) MCP-1 and TGF-β. The housekeeping gene RPS9 was used to estimate the quality and quantity of used cDNA.
Panel RPS9 of figure 24 enlarged:

Panel SP-C of figure 21 enlarged:

Note that the differences between those two images can be explained by differing image adjustments. To illustrate this point, here is an adjusted version of the RPS9 panel of figure 24 (higher contrast, higher exposure, slightly stretched vertically):
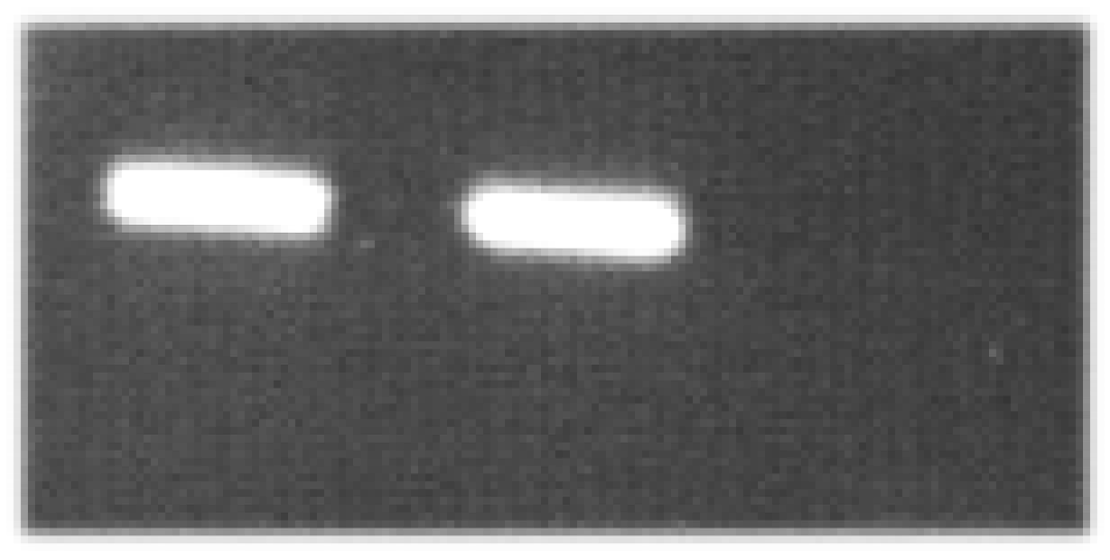
Figure 34 (page 82)[]
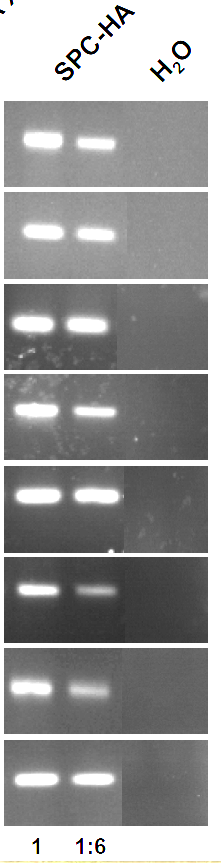
There are two problems with figure 34:
- In all 8 panels on the right side the H2O control has been pasted in, which can be seen looking at the differing backgrounds. Also, the H2O part of each panel is a separate image in the PDF file of the thesis and can be selected separately.
- In addition, the pasted in H2O controls are identical for the Foxp3 and the IL-10 panel as can be seen from the characteristic light specs on identical spots in the background of the two controls.

- Figure 34: Semi-quantitaive RT-PCR analysis of re-isolated CD4+ T cells prior cocultured with AECII from SPC-HA x TCR-HA, SPC-HA and BALB/c mice. To assess the effect of AECII derived from SPC-HA x TCR-HA double transgenic mice, SPC-HA transgenic mice and BALB/c control mice on the phenotype of antigen-specific CD4+ T cells the expression of different molecular marker genes for regulatory T cells including CD103 (alphaEbeta7), Neuropilin-1, GITR (TNFRSF18), Foxp3, Galectin, PD-1 and IL-10 was analyzed. RPS9 was used as a housekeeping gene. Different amounts of cDNA (undiluted (1) and 1:6 diluted) were used for the semi-quantitative RT-PCR analyses.
Right part of the Foxp3 panel of figure 34 enlarged:

Right part of the IL-10 panel of figure 34 enlarged:
Right column of figure 34 with adjusted contrast and exposure to make differences in the background more visible: